Market Overview
Stocks staged a strong recovery in Q2, with the S&P 500 gaining +15% and finishing near record highs. The Middle East conflict and oil shock that started in Q1 continued for most of Q2, but oil prices fell as the two sides worked toward a ceasefire agreement. Meanwhile, investors’ enthusiasm for artificial intelligence stocks returned, fueling a rally in semiconductor stocks. As companies reported strong Q1 earnings, the gains broadened beyond technology to include mid- and small-cap stocks. Even as stocks rallied, market conditions continued to evolve. The spring rise in oil prices lifted inflation to a three-year high, and the Federal Reserve signaled a shift from rate cuts to rate hikes.
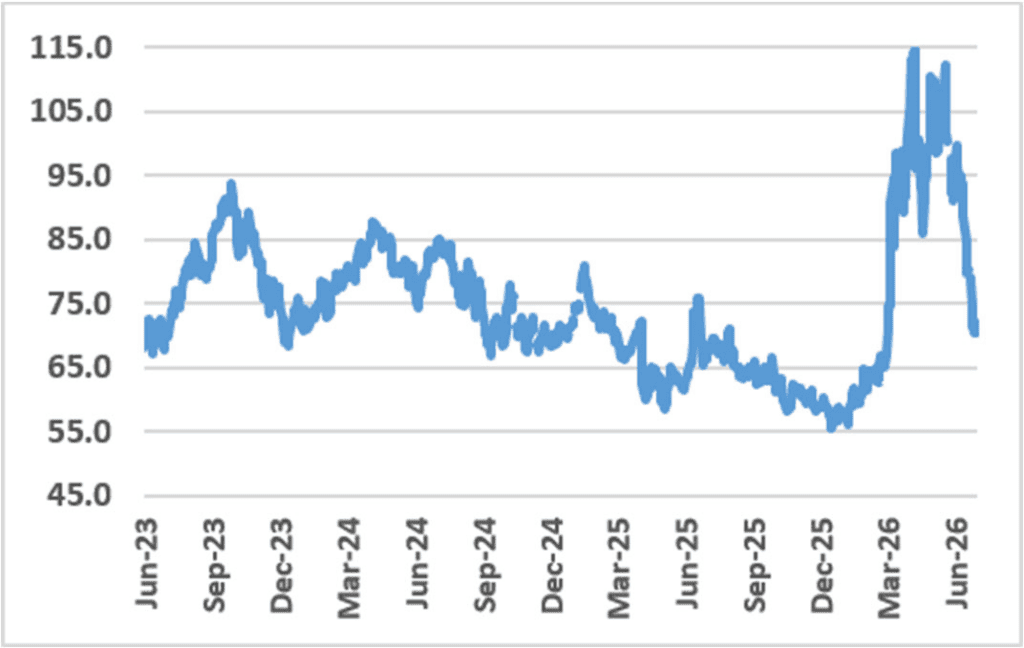
The energy shock that started in the 1st quarter unwound almost as fast as it arrived. As the chart will show, oil peaked near $115 per barrel in early April as the regional conflict closed the Strait of Hormuz which consequently disrupted global oil supply. Energy prices remained volatile throughout the quarter, but oil eventually ended the quarter closer to $70 per barrel, which was closer to where it had been trading before the conflict began. The decline followed a ceasefire between the US and Iran and expectations for the Strait, which carries upwards of 20% of global supply, to reopen. Gas prices followed suit, rising sharply during the spring before falling late in the quarter.
The price reversal matters because energy prices feed directly into inflation, which in turn shapes the outlook for interest rates. When oil spiked earlier this year, inflation followed. Consumer prices rose +4.2% year-over-year in May, the highest in three years, with over half of the monthly increase tied to energy. Excluding energy, the underlying rate was +2.9%, an indication that the rise in inflation was driven by oil rather than broad price pressure.
Crude Oil Prices – WTI
The oil price spike and the subsequent rise in inflation reshaped the interest rate outlook. Coming into the year, the market expected the Federal Reserve to cut interest rates two or three times. During the quarter, the market swung from expecting rate cuts to pricing in a rate hike this fall. The Federal Reserve held interest rates steady at both of its meetings during the 2nd quarter, but it leaned toward the market’s view, signaling that its next move could be up rather than down.
The May inflation reading is backward-looking, so it captures oil near its peak rather than where it sits today. With oil back near pre-conflict levels, the main driver of higher inflation has started to fade, and inflation is expected to ease in the months ahead. How the market handled the entire episode is what stands out during the quarter. There were stretches of volatility as the conflict dominated headlines, but stocks moved past them and finished the quarter higher.
Artificial Intelligence Spending
As noted, semiconductor stocks led the market’s advance, posting their strongest quarter in nearly 30 years. The group returned +88% for the quarter and that is after the group pulled back in late June. Really, the only comparable quarter occurred in the late 90’s during the internet bull market.
The rally has been anchored by a wave of technology investment, with much of that capital flowing to the chipmakers. The biggest spenders of this capital are names we’re all familiar with; Alphabet, Amazon, Meta, Microsoft, and Oracle. In 2025 alone, the amount spent by this group amounted to over $400 billion. Capital expenditures by this group for 2026 are estimated to exceed $700 billion and over $900 billion in 2027. The capital expenditures pay for data centers, the semiconductors inside them, and all the equipment and power needed to run it all. The companies leading the buildout are reporting record earnings and growing backlogs, and many say they are limited by how fast they can build rather than by demand.
The surge in spending is also reshaping financial markets. Private companies are going public to fund their spending, while public companies are turning to debt and equity markets to finance their buildout. SpaceX completed the largest IPO in history during the quarter, raising $85 billion. Other well-known private companies, including OpenAI and Anthropic, are expected to follow over the next year. In the public market, companies such as Alphabet and Oracle are issuing both stock and bonds to fund their spending. The amount of capital being raised, and the spending plans behind it, point to a buildout that is still expanding.
Market Rotation
Beneath the headline rally in tech, gains during the quarter were quite broad. The S&P 500 has gained 10.2% through the first half of the year but strip out the tech sector and that falls to 5.1%, an indication of how much of the index’s return comes from that one sector. Other market segments, such as small-cap (+21.5%), mid-cap (+13.8%), and international emerging market equities (+24.1%) continue to perform well during the quarter. For most of the past few years, the stock market’s gains were concentrated in a handful of mega-cap tech stocks. The market has become more balanced as this broadening has occurred.
Several developments explain why the rest of the market has been playing catch-up, the first being profitability. Smaller companies’ profit margins weakened in 2022 and 2023 as inflation spiked and the Federal Reserve raised interest rates. Small-caps tend to carry more floating-rate debt, so as the Fed cut rates in recent years, the interest savings flowed to their bottom line. The second is the economy. Smaller companies are more sensitive to domestic economic conditions, so the economy’s resilience has been a direct tailwind. There were concerns that this year’s oil shock would weigh on the global economy like past oil crises. However, today’s economy depends far less on energy than it did in the 1970s, and the impact has so far been relatively contained. The third is valuation. After years of tech stocks leading the market, smaller companies look cheaper by comparison, and their improving earnings have made that gap harder to overlook.
No single factor explains the shift, but together they make a fundamental case for why the gap has started to close. Profit margins are improving, the economy continues to expand, and parts of the market trade at valuation discounts. As this year has shown, holding a mix of company sizes, styles, and geographies means not depending on any single part of the market doing well.
More on the Market
As already mentioned, equity markets traded higher throughout the quarter, with most of the advance coming in April as stocks rebounded from their late-March lows. The strength carried into May, with the S&P 500 posting a nine-week winning streak into month-end. The index set a record high in early June before giving back some ground to finish up +15.2%, its strongest quarter since Q2 2020 which coincided with the pandemic recovery.
The Nasdaq gained +27.7% as tech stocks led the market rally, while the DJIA rose +13.4%.
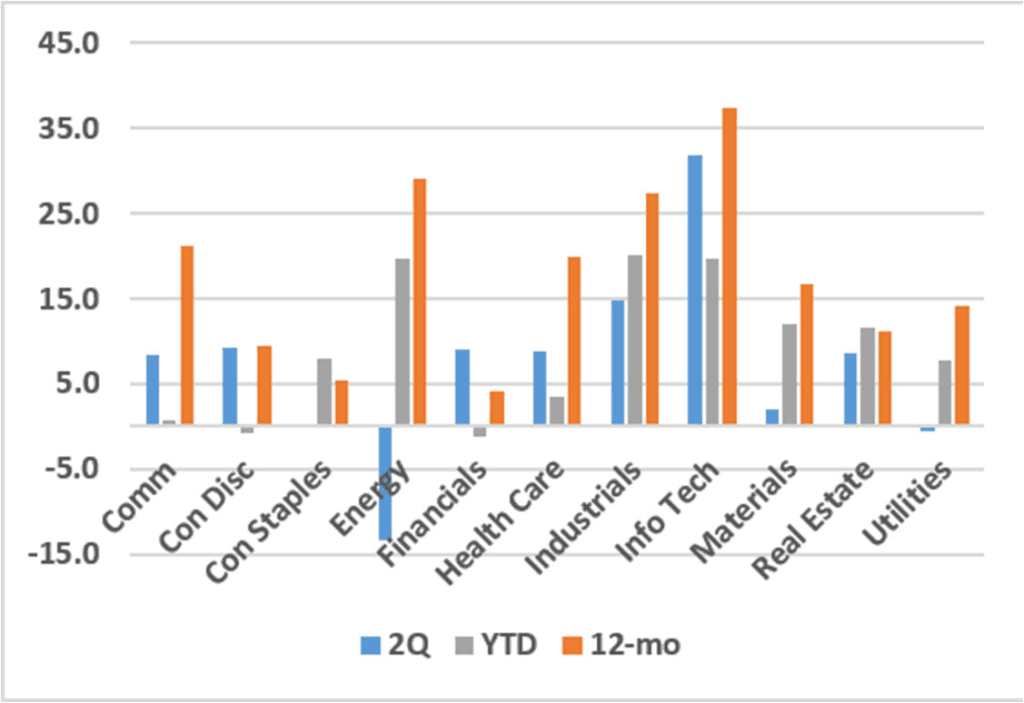
From a sector perspective, nine of the eleven S&P sectors finished higher. However, technology was the only sector to outperform the broad index, with a gain of +31.8%. Of the remaining sectors, industrials, consumer
discretionary, and financials each rose more than +9.0%. Defensive sectors such as utilities and consumer staples were relatively flat while energy was lower to the tune of -13.5% as oil prices fell.
S&P 500 Sector Performance
International
Shifting to international equities, the MSCI EAFE Index rose 10.8% for the quarter and is up 9.4% through the first half of the year. The dominant driver was continued momentum in artificial intelligence and related capital investment cycles, which strengthened technology-heavy markets and economies that are embedded in semiconductor and advanced electronics supply chains. Investors increasingly favored growth-oriented companies with long-term earnings drivers over cyclical exposure. At the same time, moderating inflation pressures and relatively stable interest rate expectations supported investors’ risk appetite.
Eurozone equities were strong performers over the quarter. Information technology and financials led the way based on strong corporate earnings. Energy and communication services posted negative returns for the quarter. Energy stocks suffered as oil prices dropped down to levels seen before the outbreak of hostilities in the Middle East. UK stocks gained during the quarter, although declines for the heavyweight energy sector capped overall progress. The top performing sectors included consumer discretionary, real estate, and financials. The Euro area’s annual inflation rate ticked up slightly mid-quarter which led to a 25-bps increase in rates by the European Central Bank. Data provided by Eurostat also showed that eurozone GDP fell by 0.2% during the first quarter.
Japanese equities delivered robust gains in the 2nd quarter with the tech-heavy Nikkei 225 index up over 37%. Investor sentiment was lifted by receding Middle East tensions following the US-Iran ceasefire memorandum which saw oil prices decline. Stocks also drew support from broadly in-line monetary policy outcomes from both the Fed and the Bank of Japan. The latter raised its policy rate by 25 bps to 1.0% in June. The yen continued to be weak over the quarter, reaching a neat 40-year low versus the dollar, which ultimately provided support for exporters. AI and semiconductor related stocks and financials outperformed, though valuation concerns and profit-taking in AI names introduced intra-month volatility in June.
Emerging markets rose sharply in the 2nd quarter with a gain of 24.1%, its strongest absolute quarterly performance since 2009. For the year-to-date period, the index is up 23.9%. Like other markets around the globe, returns were dominated by technology-oriented markets such as Taiwan and Korea. Also, like other markets, the emerging markets judged the Middle East conflict to be largely contained, with the fragile peace agreement helping to ease some geopolitical concern.
Korea was the standout performer as it rallied sharply to all-time highs boosted by outsized returns in memory and AI-related stocks. Korean companies delivered strong earnings and EPS revisions, while increased domestic buying also contributed to market rally. It was a similar story in Taiwan. Strong earnings from technology stocks
boosted the market as US hyperscaler capital expenditures continued to benefit the north Asia hardware supply chain. Smaller market such as Hungary and Egypt also outperformed, but the remaining EM markets lagged the broader index. India lagged as the country’s IT services sector continues to be seen as at risk from AI. China lagged against a backdrop of mixed economic data, weakness from internet stocks, and less exposure to the AI-driven rally.
Commodities
The Bloomberg Commodity Index declined in the 2nd quarter as weakness across energy, agriculture, and precious metals more than offset gains in industrial metals.
Energy was the largest detractor from commodity results. Prices for crude oil and refined products fell as fears of Middle East supply disruptions eased following a ceasefire in the US/Iran/Israel conflict, while OPEC production increases further reinforced expectations for increased supply.
Agriculture prices moved lower as improving crop conditions and favorable weather across key growing regions boosted expectations for strong harvests. Grain prices appeared to come under pressure from robust planting progress and ample supply prospects, while lower energy prices reduced both agricultural input costs and demand for biofuel feedstocks, including soybean oil, corn-based ethanol and sugar-based ethanol.
Precious metals edged lower despite ongoing geopolitical uncertainty. Higher real interest rates, a stronger US dollar and diminished demand for perceived safe havens appeared to reduce investor appetite for gold and silver.
Industrial metals were the lone bright spot, led by copper, which benefited from tightening mine and smelter supply and continued electrification-related demand.
Fixed Income
The second quarter was positive for global bonds although volatility remained elevated. The Middle East conflict remained in full focus, with the direction of bond yields closely tracking energy markets. As escalation fears intensified mid-quarter, government bond yields rose to multi-year highs before reversing on encouraging signs of a potential US-Iran agreement. Performance diverged across bond markets. Japan and the US underperformed overall, while within the eurozone, Germany lagged noncore and peripheral markets, with Greece the strongest performer.
Central banks were cautious but increasingly alert to renewed inflation pressure. The Federal Reserve left its target rate unchanged at 3.50% – 3.75% during the quarter, maintaining that policy was sufficiently restrictive. Kevin Warsh was approved as Powell’s successor, chairing his first meeting in June.
The US Treasury curve flattened, as yields rose in shorter maturities but fell slightly at the longer-dated end of the curve. Stronger-than-expected data reinforced expectations that monetary policy would need to remain restrictive. The rise in non-farm payrolls exceeded expectations and the overall resilience of the labor market supported the view that the US economy could absorb higher energy prices better than feared.
In June, the European Central Bank raised rates by 25 basis points, taking its main policy rate to 2.25%. Revised projections showed higher inflation assumptions and weaker growth, while President Lagarde stressed that policy remained date-dependent and not on a predetermined path.
UK gilts were influenced by both global inflation concerns and domestic politics. In April, the 10-year gilt yield reached its highest level since 2008, reflecting the inflationary consequences of higher energy prices as well
as concerns over fiscal and political vulnerabilities ahead of local elections. Keir Starmer resigned as prime minister in June and has just recently been replaced by Andy Burnham. The Bank of England kept the base rate
unchanged at 3.75%, stating that easier labor market conditions and weaker economic growth should help
contain underlying inflation pressures.
Elsewhere, the Bank of Japan raised its policy rate by 25 basis points to 1.00% in June, its first increase since December. Policymakers signaled that further tightening was possible, particularly if inflation continued to deviate above the 2% target.
2026 Outlook
Stocks ended the first half of the year near all-time highs as they rebounded from volatility earlier in the year. The conflict behind that volatility isn’t fully resolved, but oil prices have fallen back near pre-conflict levels. There were concerns the oil spike would slow the global economy, like past energy crises, but the economy has held up so far with few signs of significant stress. What’s left is a set of open questions related to the path of oil prices and its affect on inflation, the durability of the AI investment cycle, and whether the market’s broadening continues. The remainder of this year will be shaped by how each plays out.
The first is the path of inflation and interest rates. With oil back near where it started, inflation is widely expected to ease. The question is whether the cooling shows up in the coming inflation reports. If it does, it would take some pressure off the Federal Reserve. If inflation remains elevated, the Fed’s cautious stance is likely to persist, with a rate hike on the table. The next few inflation reports will go a long way toward answering what the Fed does next.
The second is the AI buildout. The spending behind it is enormous, and the gains in the stock market have been big. The question now is whether both can hold. The AI trade has become popular, and the late-quarter pullback in technology showed how quickly stock prices can swing when expectations are high. Over time, the spending will need to translate into real profits to justify the scale, especially as a growing share of it is funded by issuing new debt and stock. The past quarter showed the promise of the technology and served as a reminder of how much is already expected of it.
The third is whether the market’s broadening continues. This year has been unique, with broad participation across the market existing alongside narrow leadership at the very top. Most sectors and company sizes have participated in the stock market rally, even as a small group of technology stocks have driven the largest share of the returns. The question is whether the gains keep spreading or leadership narrows again to a handful of names.
A list of open questions can naturally create some unease, so it’s worth looking at how the past quarter unfolded. The market faced a war, an energy shock, inflation at a three-year high, and a Federal Reserve signaling a potential rate hike. Through all of it, stocks not only held their ground but traded to new highs. We can’t know exactly how the questions will resolve, but a diversified portfolio and a long-term perspective can help navigate periods of uncertainty.
Published July 2026
References
1. S&P 500 Sector Return Data
2. Crude Oil Prices – WTI – Federal Reserve Economic Data: crude oil prices, West Texas Intermediate.
Disclaimer
Please remember that past performance may not be indicative of future results. Different types of investments involve varying degrees of risk, and there can be no assurance that the future performance of any specific investment, investment strategy, or product (including the investments and/or investment strategies recommended or undertaken by Chesapeake Wealth Management), or any non-investment related content, made reference to directly or indirectly in this newsletter, will be profitable, equal any corresponding indicated historical performance level(s), be suitable for your portfolio or individual situation, or prove successful. Due to various factors, including changing market conditions and/or applicable laws, the content may no longer be reflective of current opinions or positions. Moreover, you should not assume that any discussion or information contained in this newsletter serves as the receipt of, or as a substitute for, personalized investment advice from Chesapeake Wealth Management. To the extent that a reader has any questions regarding the applicability of any specific issue discussed above to his or her individual situation, he or she is encouraged to consult with the professional advisor of his or her choosing. Chesapeake Wealth Management is neither a law firm nor a Certified Public Accounting firm and no portion of the newsletter content should be construed as legal or accounting advice.
Learn more about Chesapeake Wealth Management by visiting https://ches.bank/wealth-management/.
*Investments, insurance, and annuity products are not FDIC insured, are not guaranteed by Chesapeake Bank, and may lose value.
*Securities offered through Osaic Institutions, Inc. Member FINRA / SIPC
*Chesapeake Wealth Management is a subsidiary of Chesapeake Financial Shares. Osaic Institutions is not affiliated with either entity.
*Chesapeake Wealth Management is a subsidiary of Chesapeake Financial Shares. Osaic Institutions is not affiliated with either entity.
*FINRA Broker Check
Not a deposit, Not FDIC insured, Not insured by any government agency, Not guaranteed by the bank, May go down in value.