Market Overview
The year had started favorably with the support of solid economic fundamentals, including a robust labor market, easing inflationary pressures and steady consumer spending. The market reached a record high by mid-January, as investors anticipated continued earnings growth across multiple sectors. Some volatility did occur in late January and through February, as investors worried that strong economic growth could delay any further interest rate cuts by the US Federal Reserve.
Geopolitical events at the end of February brought far greater concerns. The US and Israeli strikes on Iran disrupted the flow of oil through the Strait of Hormuz and created considerable uncertainty for the global economy and financial markets. The surge in oil prices and increased risk aversion among investors caused stocks to retreat. Throughout March, investor sentiment vacillated between hopes for de-escalation and fears of a prolonged conflict.
Rising Oil Prices
One of the big stories of the first quarter was the rise in the price of oil. Prices began to rise in January (+13%) due to supply concerns related to Venezuelan output and tensions in the Middle East. Prices rose another 4% in February as regional geopolitical tensions continued to rise. By March, with the outbreak of hostilities and the closure of the Strait, through which some 20% of global oil flows, the price of crude oil surged nearly 50%. Overall, the price of crude rose over 70% during the quarter.
Crude Oil Prices – WTI
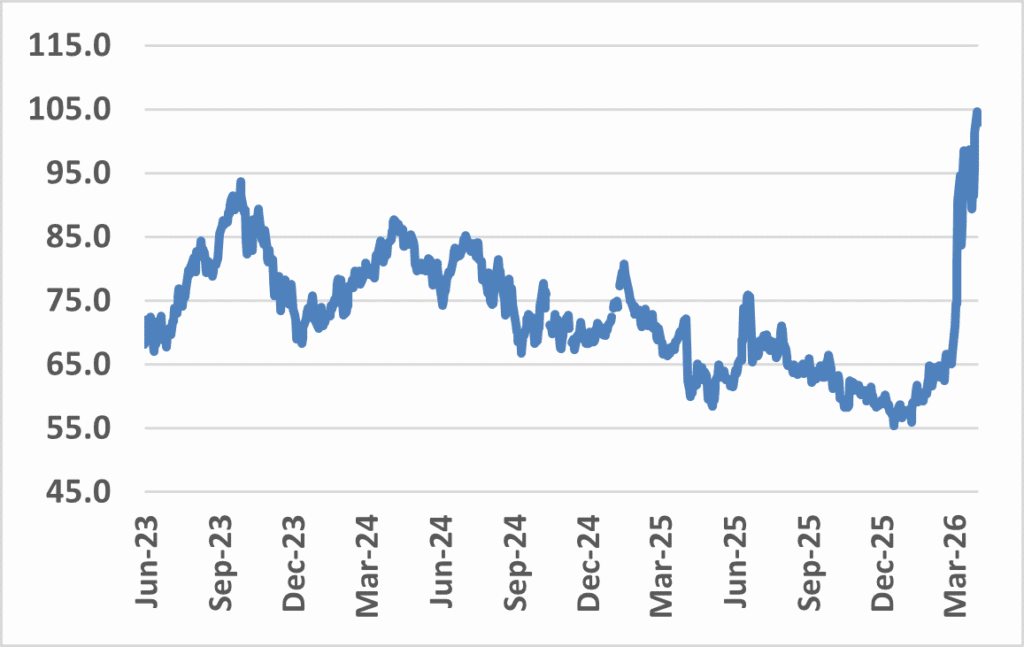
The rise in oil prices is a concern for many reasons. One in particular is its connection to inflation and, therefore, Federal Reserve policy. Higher energy costs feed into the prices that businesses and consumers pay. Higher oil prices are particularly relevant at this time because inflation had already been firming up in a range above the Fed’s preferred 2% target. The Fed’s preferred inflation gauge, Core Personal Consumption Expenditure (CPE), remains near 3% and producer-level price inflation has likewise been rising in recent months.
The combination of rising oil prices and the risk of renewed inflation pressure led to a shift in the expectations of future rate cuts. At the start of the year, the market expected the Federal Reserve to cut rates two to three times by year-end. However, the forecast changed as the market steadily priced out rate cuts during the quarter. Those rate cuts were completely removed by quarter-end. In a development that signifies how drastically events have changed things, the possibility of a rate hike has been discussed, though the probability remains fairly low.
The situation remains fluid heading into the second quarter. As of quarter-end, the Strait of Hormuz is still closed, and negotiations are ongoing. Oil trades near $100 per barrel, an indication that the market expects the disruption to continue. The April and May inflation data will be among the first reports to capture the impact of higher energy prices, and the market will be searching for clarity around the inflation outlook and interest rate policy. While the market waits for more data, headlines and developments in the Middle East will likely impact how stocks and bonds trade in early Q2.
Market Rotation
One of the quarter’s more interesting developments was the gap in performance across various segments of the equity markets. We’ve become accustomed to the S&P 500 leading the way, however, the market-cap weighted broad market index declined 4.3% during the first quarter while the equal-weighted version of the same index gained 0.7% over the same period. With the cap-weighted version having come to be dominated by the tech heavy Mag-7 names, these results would indicate greater breadth in the U.S. large-cap market. Another indicator of this rotation can be seen in the performance of the tech-heavy Nasdaq 100 having declined 5.8% during the quarter. Small-cap and mid-cap equities benefited from this rotation as the Russell 2000 gained 0.9% and the Russell Mid-Cap gained 1.3% for the quarter. International equities, which had performed quite well in 2025, were negative for the quarter yet still outperformed the U.S. large-cap market. The takeaway, as always, is that a diversified portfolio is your best bet.
Even prior to the breakout of hostilities in the Mid-East, a shift in market leadership was evident. Among the catalysts, investors began moving away from the concentrated mega-cap trade that had come to dominate over the past two years. This rotation accelerated in February as concerns about disruption from artificial intelligence spread across the market, particularly among software companies. Benefitting from this rotation were value stocks of all capitalizations.
Other factors affecting market rotation include an encouraging uptick in manufacturing data and ongoing developments in artificial intelligence. The ISM Manufacturing Index, which surveys purchasing managers at U.S. factories, gauges whether the sector is expanding or contracting. After spending nearly a year below 50, which indicates contraction within the industry, the index crossed into expansion in February and held that level in March. The rise above 50 suggests the manufacturing sector, which has been a soft spot in the economy since 2022, was gaining traction before the conflict. Equity markets reflected that shift, with the Industrials sector setting a new all-time high in late February. The March stock market sell-off reflected expectations about the potential impact of higher oil prices on future conditions rather than current weakness. Incoming data over the next several months will start to measure the real economic impact.
For the past two years, AI has been seen as a productivity tool to help existing companies do more with less. However, multiple product launches early in the quarter changed the way investors view AI. The market started to price AI as a potential replacement for entire categories of professional services, not just a tool to make companies more efficient. The software industry was hit particularly hard and has declined nearly 30% from its peak last October. The broader question of how AI will reshape professional services and the enterprise software industry is far from resolved, and its effects may continue to surface across the market as AI tools evolve.
More on the Market
The S&P 500 declined -4.3% in the first quarter, ending its three-quarter winning streak. The decline was concentrated in March, while January was modestly positive and February was flat. As discussed earlier, company size impacted returns. The largest companies, particularly those in the technology sector, drove the decline. The Nasdaq, which has exposure to many of the leading mega-cap tech companies, declined nearly -6%. The sell-off weighed on growth stocks, which declined nearly -10%, while Value gained +2.1%. Value outperformed Growth in each month, a level of consistency that is notable regardless of the market environment. Small-cap stocks held up better despite the volatility, with the Russell 2000 Index gaining nearly +1%.
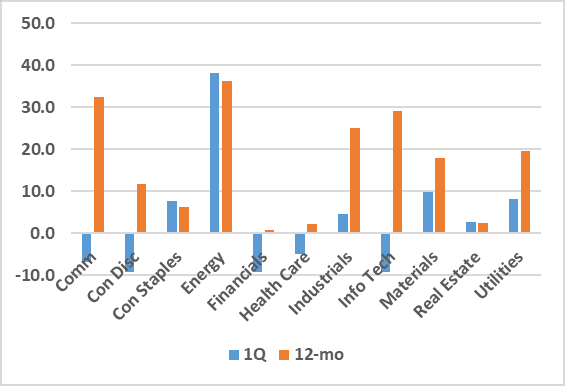
Sector performance reflected the quarter’s key themes. Energy was the top-performing sector with a gain of 38%, benefiting from the sharp rise in oil prices. Materials, Utilities, and Consumer Staples each gained over +7.5%, with the Industrial and Real Estate sectors also trading higher. In contrast, Financials, Consumer Discretionary, and Technology each declined over 9%. The gap between the top and bottom sectors was wide, with over 45% separating Energy and Financials. Six of the eleven S&P 500 sectors outperformed the broad index, a sharp contrast to recent years when a few sectors drove the S&P 500’s gains.
S&P 500 Sector Performance
International
Shifting focus outside the U.S., international equities, as measured by the MSCI EAFE Index, outperformed for a second consecutive quarter. International equities finished the quarter lower by 1.2% yet finished ahead of the S&P 500 by roughly 3%. International’s outperformance was concentrated in January and February, while March was more challenging as international stocks declined alongside U.S. stocks.
Headlines were understandably dominated by the conflict’s implications across global markets and economies, from commodity prices and oil supply to fertilizer and agricultural prices. Since the conflict began, shipping through the Strait of Hormuz has been limited, with Iran blocking most traffic.
A major effect of the Strait’s closure has been rising oil prices. Over the course of March, global Brent crude prices rose from just over $70 per barrel to nearly $120. As a major input to a vast array of goods, rising oil prices could quickly translate into higher prices broadly, and indeed, euro zone inflation has already risen from 1.9% in February to 2.5% in March. The UK’s most recent reading was also unchanged at 3% but is likewise expected to climb.
Given the intense focus on inflation, it is hardly surprising investors paid close attention to central banks during the month. To date, major global central banks have held rates steady, including the European Central Bank, Bank of England and Federal Reserve. The Bank of Japan paused its nascent hiking cycle, citing the ongoing Middle East war and higher energy prices, but maintained its hawkish tone. The Reserve Bank of Australia stood alone (at least for now) among developed market central banks in raising rates, increasing them by 25 basis points to 4.1%. However, barring a near-term reversal in oil prices and broader inflation, it seems reasonable to anticipate others may join Australia in the months ahead.
Emerging markets delivered slightly negative performance for the quarter. Returns were driven by the large technology-oriented markets of Korea and Taiwan, alongside strong performance from Latin American countries, while India remained a notable drag.
It was a tale of two differing market themes over the quarter, with Taiwan and Korea leading strong outperformance in January and February, supported by a weaker US dollar and ongoing strength in AI-related technologies. However, the Mid-East conflict led to a sharp reversal in March, as high energy costs, supply chain disruptions and uncertainty weighed heavily on global risk sentiment. South Africa lagged broader EM peers amid higher oil prices, currency depreciation and inflation concerns, although this was somewhat offset by higher precious metals prices during the quarter. China underperformed as AI-related advancements pressured internet stocks, although the country was better positioned to absorb spillover from the Mid-East conflict given its large oil reserves and diversified energy mix.
Commodities
In the first quarter, the Bloomberg Commodity Index rose 24.4%, delivering its strongest return since the first quarter of 2022 when the index rose 25.6% during the early stages of Russia’s invasion of Ukraine. All four of the index’s primary sub-categories posted gains, with energy accounting for more than 70% of the total return. Within energy, diesel and heating oil led results, reflecting their dependence on crude oil inputs and supply chains that were already structurally tight before the Middle East conflict.
Agricultural commodities posted gains. Wheat rose on weather-related production risks across the US Southern Plains, the Black Sea region and Western Europe. Rising oil prices boosted soybean oil and sugar prices as these are biofuel inputs that benefit from stronger demand for renewable diesel and ethanol.
Industrial metals advanced largely due to higher aluminum prices after missile and drone strikes and related disruptions curtailed aluminum output in the UAE, Bahrain and Qatar, removing an estimated 3-4% of primary aluminum production from the global market. Precious metals ended the quarter higher despite a March selloff driven by a stronger US dollar and rising interest rates.
Fixed Income
The bond market also experienced a volatile quarter as Treasury yields reacted to the changing landscape. Interest rates rose in January as the administration issued another round of tariff threats, while February and March were nearly mirror images. Yields fell sharply in February as concerns about AI disruption caused stocks to trade lower, followed by a sharp reversal higher in March as oil prices spiked and the probability of rate cuts declined. The 10-year yield ended the quarter near 4.32%, the highest since June 2025, after briefly touching 4.45% in late March. The 2-year yield ended near 3.79%, up nearly +0.35%. The rise in shorter-term yields reflected the shift in rate-cut expectations, as markets adjusted from pricing in rate cuts to the possibility that rates may remain at current levels for longer.
The rise in interest rates weighed on bond returns. The Bloomberg U.S. Aggregate Bond Index was flat for the quarter as Treasury yields rose, after returning +1% or more in the prior four quarters. Corporate bonds modestly underperformed higher-quality bonds like US Treasuries due to their credit risk exposure. Credit spreads, which measure the difference in yield between corporate and government bonds, widened during the quarter. The high yield spread widened to its highest level since early 2025, reflecting increased caution among investors and uncertainty about the impact of higher energy prices on the economy and corporate earnings. However, despite the recent widening, corporate credit spreads remain well below levels reached during past recessions and financial crises. The market is pricing in caution, but it’s not signaling stress.
2026 Outlook
The key development to watch heading into the second quarter is the situation in the Middle East and its impact on oil prices. The Strait of Hormuz was still closed at quarter-end with negotiations ongoing. Progress toward a resolution would likely ease energy costs and reduce inflation pressures, giving the Federal Reserve more flexibility on interest rate policy. A prolonged disruption would give higher oil prices more time to work their way through to the economy, potentially affecting consumer spending and business investment while keeping inflation elevated. The connection between oil prices, inflation, and Federal Reserve policy is the thread that tied the quarter together. Higher oil prices contributed to the shift in rate cut expectations, and the upcoming April and May inflation data will be the first reports to capture the full impact of higher energy costs. How those readings come in will shape the outlook for interest rates and the broader economy.
While the market’s decline in the first quarter drew attention, it’s worth stepping back to look at the bigger picture. When earnings rise, stock prices generally follow. When earnings decline, as they did during the 2001 recession, the 2008 financial crisis, and the 2020 pandemic, stock prices tend to fall. What stands out about the current environment is that earnings estimates have continued to rise even as the S&P 500 has pulled back. Analysts still expect earnings growth in the coming quarters, and profit margins remain healthy. The market’s decline has been driven by uncertainty around oil prices, inflation, and Fed policy, not by a deterioration in the fundamentals that drive stock prices over time. That distinction is important for long-term investors.
The first quarter also reinforced the importance of portfolio diversification. The areas of the market that led over the past two years underperformed to begin the year. Investors with broad exposure across company sizes, investment styles, sectors, and geographies generally experienced a more moderate decline than the S&P 500. Staying invested through periods of market volatility, maintaining portfolio diversification, and keeping a long-term perspective remains one of the most effective approaches for building wealth.
Brian T. Moore, Vice President Trust Officer, Chesapeake Wealth Management
Published April 2026
References
1. S&P 500 Sector Return Data
2. Crude Oil Prices – WTI – Federal Reserve Economic Data: crude oil prices, West Texas Intermediate.
Disclaimer
Please remember that past performance may not be indicative of future results. Different types of investments involve varying degrees of risk, and there can be no assurance that the future performance of any specific investment, investment strategy, or product (including the investments and/or investment strategies recommended or undertaken by Chesapeake Wealth Management), or any non-investment related content, made reference to directly or indirectly in this newsletter, will be profitable, equal any corresponding indicated historical performance level(s), be suitable for your portfolio or individual situation, or prove successful. Due to various factors, including changing market conditions and/or applicable laws, the content may no longer be reflective of current opinions or positions. Moreover, you should not assume that any discussion or information contained in this newsletter serves as the receipt of, or as a substitute for, personalized investment advice from Chesapeake Wealth Management. To the extent that a reader has any questions regarding the applicability of any specific issue discussed above to his or her individual situation, he or she is encouraged to consult with the professional advisor of his or her choosing. Chesapeake Wealth Management is neither a law firm nor a Certified Public Accounting firm and no portion of the newsletter content should be construed as legal or accounting advice.
Learn more about Chesapeake Wealth Management by visiting https://ches.bank/wealth-management/.